|
Oct 24, 2011
|
SQLalchemy UML диаграмма
Примечание
UPD: sadisplay - замечательная штука!
Для визуализации своей базы в SQLAlchemy удобно использовать graphviz и библиотеку sqlalchemy_schemadisplay.
Установка:
$ apt-get install graphviz
$ pip install sqlalchemy_schemadisplay
Далее читаем доки SQLAlchemy Schema Display
Для Ъ:
Схема БД строится на основании данных базы.
from sqlalchemy import MetaData
from sqlalchemy_schemadisplay import create_schema_graph

# create the pydot graph object by autoloading all tables via a bound metadata object
graph = create_schema_graph(
   metadata=MetaData('postgres://user:pwd@host/database'),
   show_datatypes=False,   # The image would get nasty big if we'd show the datatypes
   show_indexes=False,     # ditto for indexes
   rankdir='LR',           # From left to right (instead of top to bottom)
   concentrate=False       # Don't try to join the relation lines together
)
graph.write_png('dbschema.png') # write out the file

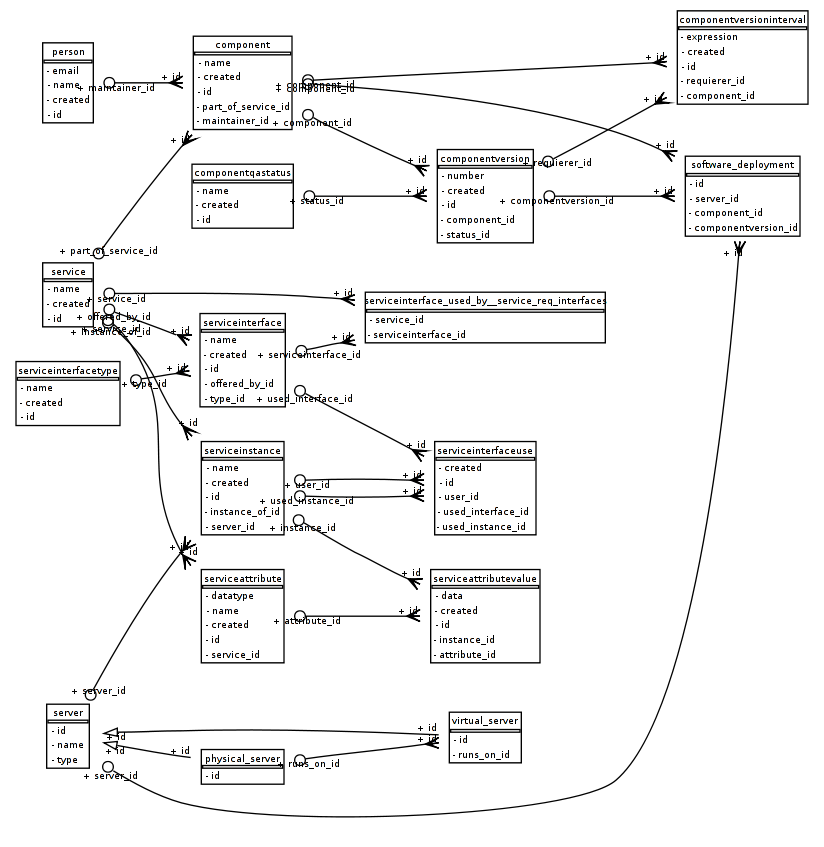
Схема БД Postgres
Схема UML строится по моделям проекта.
from myapp import model
from sqlalchemy_schemadisplay import create_uml_graph
from sqlalchemy.orm import class_mapper

# lets find all the mappers in our model
mappers = []
for attr in dir(model):
    if attr[0] == '_': continue
    try:
        cls = getattr(model, attr)
        mappers.append(class_mapper(cls))
    except:
        pass

# pass them to the function and set some formatting options
graph = create_uml_graph(mappers,
    show_operations=False,       # not necessary in this case
    show_multiplicity_one=False  # some people like to see the ones, some don't
)
graph.write_png('schema.png') # write out the file

Схема моделей в Pylons
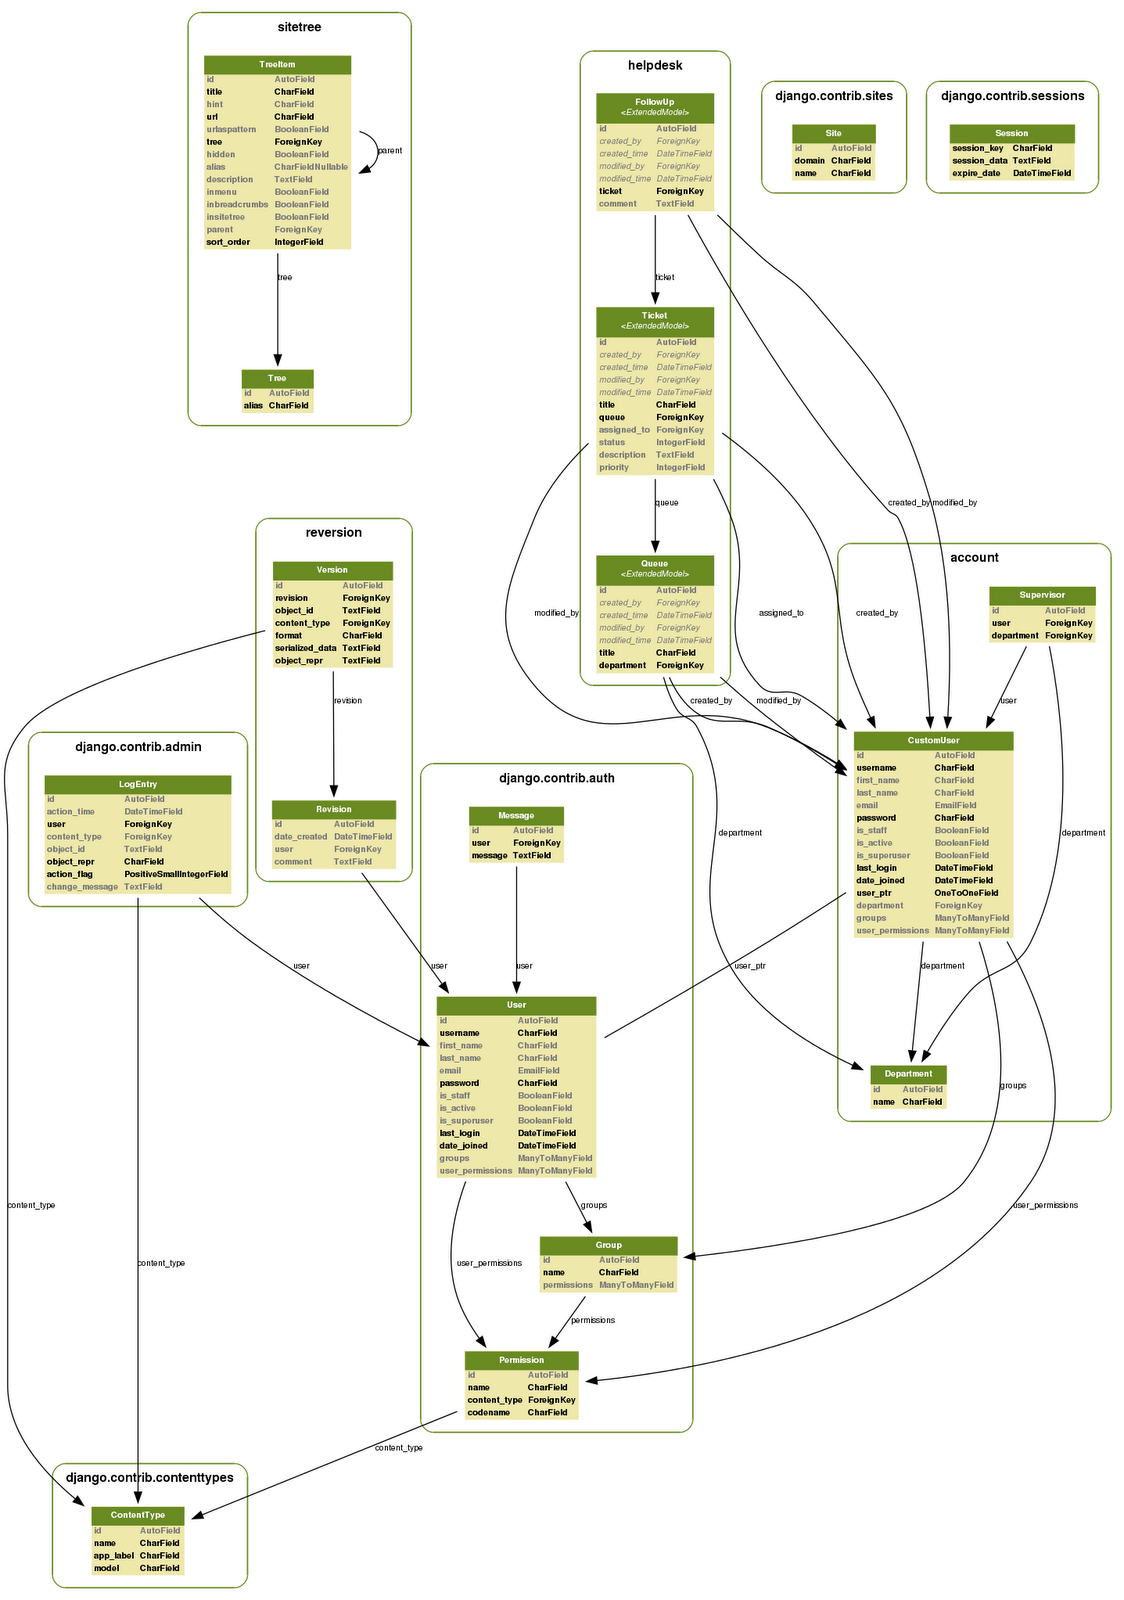
Для Django кодеров есть модуль django-extension который добавляет
много полезных команд для manage.py. Вот мой вариант скрипта для Django:
project_dir/_visualozation/visualized.sh
curent_d="`date +%H%M_%d%m%y`"
exec python ../manage.py graph_models -a -g -o scheme_of_$curent_d.png

пример django-extension + graphviz